
Modeling Software Delivery
Visualize the dynamics of your delivery workflows with causal feedback diagrams.

Product engineering focuses heavily on practices, tools, and roles, but what about interactions and cause-effect relationships? These are harder to understand and reason about because they’re more complex. Interplays between people and their motives create tensions that, unchecked, can become big problems.
In this post, I’ll introduce a modeling tool I like to use to spark this level of analysis called causal loop diagrams. I want to answer the somewhat ambitious question, “How do choices in product or engineering impact one side, the other, and the whole?”
Causal Loops: A Primer
Causal loops show us the relationships between variables in a system. As one variable increases, what happens to other variables? Do they move in the same or opposite directions? This is best explained in a picture.

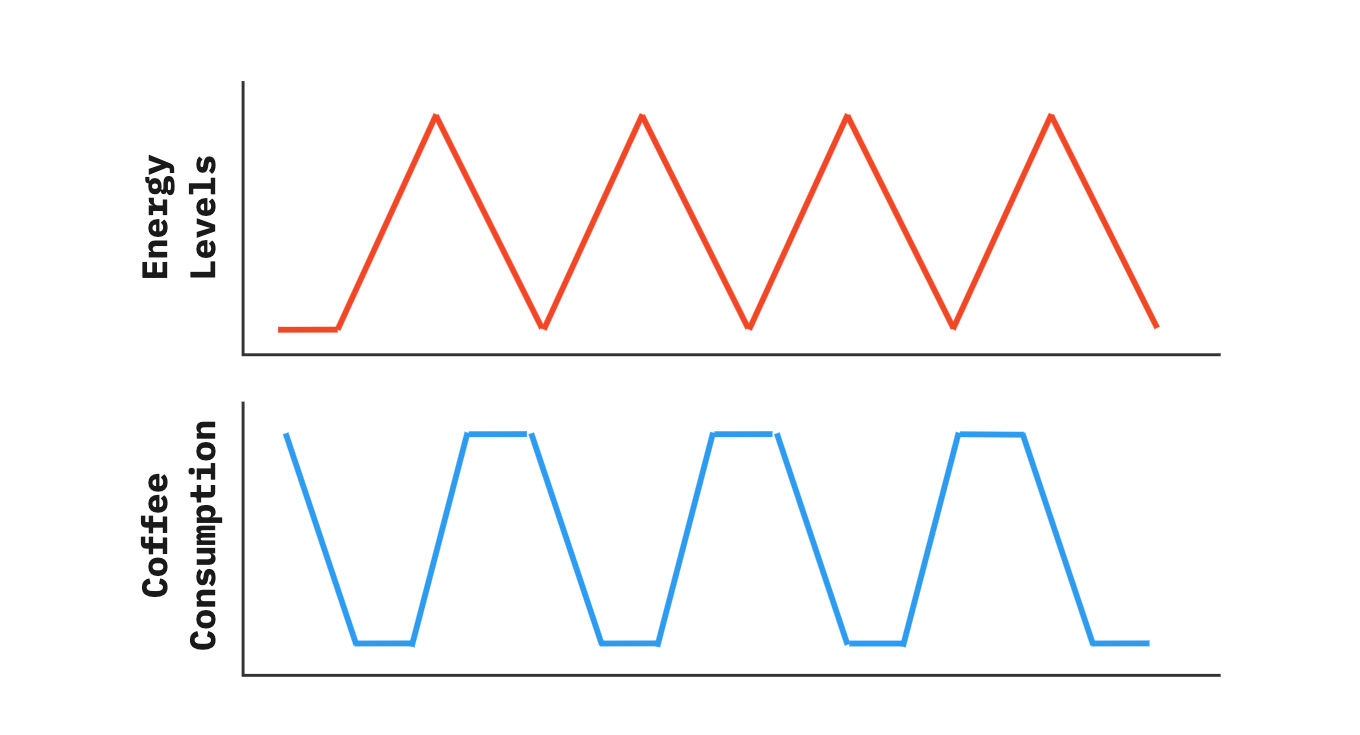
We’ve mapped two variables: “Energy Levels” and “Coffee Consumption.” As energy decreases throughout the day, we drink more coffee to get a boost. As we drink more coffee, our energy levels increase. Fun fact: French author and playwright Honoré de Balzac drank over 50 cups of coffee daily!
This is called a balancing loop. It shows a person using coffee to maintain energy levels throughout the day. It’s like the thermostat in your home, keeping a steady temperature. If we were to graph the values over time, it might look like this:
We can model additional variables. For example, what would happen to our sleep quality if we drank coffee all day and all night?
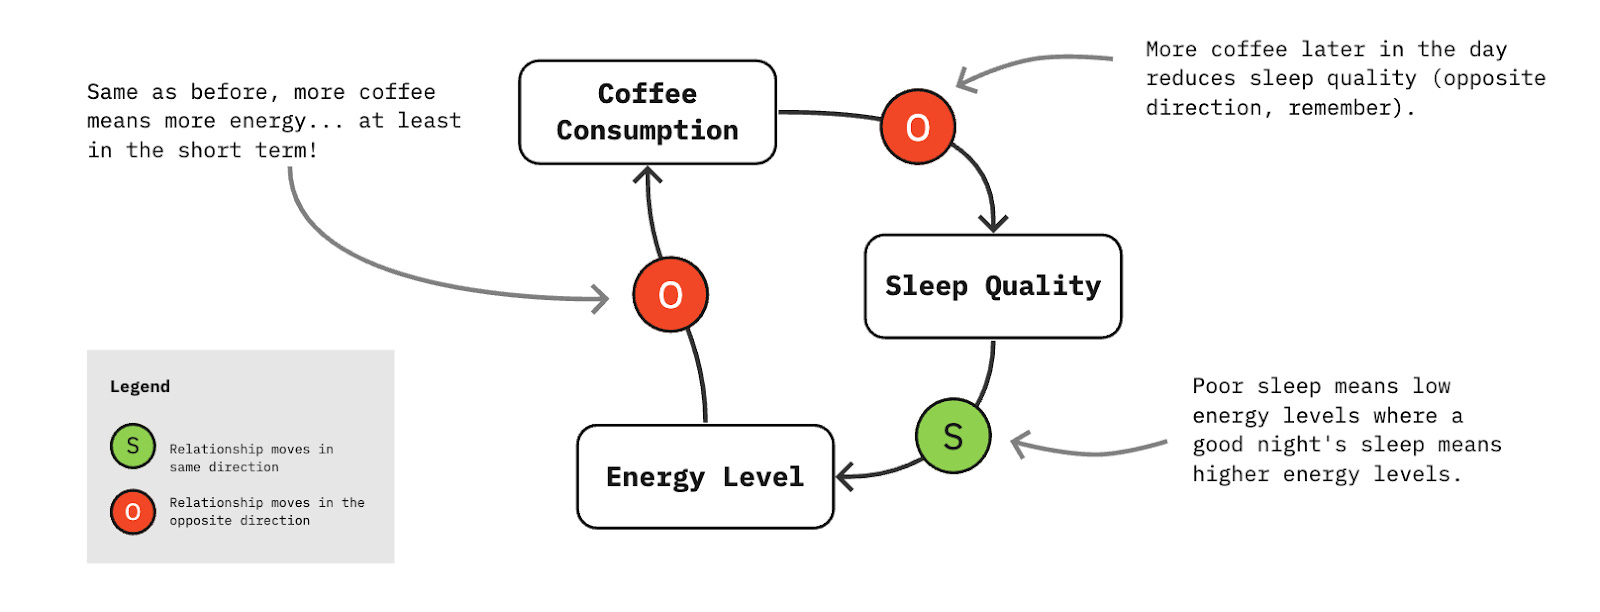
Following the variables, their relationships, and their directions, let’s draw some inferences:
As before, we may need more coffee when our energy level dips (these variables tend to move in opposite directions).
When we get a good night’s sleep, we have more energy to start the day.
When we start with more energy, we may need less coffee.
The less coffee we drink, particularly later in the day, the more sleep quality we’ll enjoy.
There’s more to causal loop diagrams, but this is a good enough introduction for today’s purpose.
Modeling Software Delivery

I use this causal loop diagram in some of our workshops to stoke conversation around the variables and levers we have in software delivery. What variables might we use to experiment on improving the overall system?
I model “Delivery Speed (Throughput)” as what business and product people tend to care about when it comes to delivery. When talking to these folks, we might show them how excessively prioritizing everything as high might contribute to longer cycle times and less throughput.
I model “Investment” as what technical people may do to improve their system, automate toil, or pay back some technical debt. Perhaps they could build a case for making technical investments, showing that reduced debt will increase throughput by reducing cycle times.
Is this model comprehensive? Nope. We might add “Test Inventory” if we approached our testing strategy differently. I could add “Defect Rate” or “Quality” to the mix, particularly in systems with a high frequency of hotfixes or support requests.
Even as is, you can draw many inferences (see callouts in the diagram), but the real value in this visualization is bringing two groups (product & engineering) who might want different things into a discussion about systemic balance. When we baseline this understanding, meaningful tradeoff discussions and good-faith negotiations can start.
Chat Your Model
It’s fun to drop your causal loop diagrams into the LLM chatbot of your choice and toss around some what-if scenarios. Check your work, but I was surprised by the accuracy ChatGPT 4o gave me in its answers.
Copy the image above and paste it into a chat. Start asking questions like:
What variables might I add next?
What happens if we reduce WIP?
What would happen if we increased investment?
What would happen if we made our work items (tickets, stories) smaller?
What other variables may impact the amount of WIP we carry?
Assuming we keep WIP limits low, can you graph how throughput and investment might change?
This technique is a great way to kick the tires of your model before you start socializing it with your people partners.
Taking it to the Streets: Countermeasures
Causal loop diagrams are like any artifact. Most of their value comes from socializing them. The arguments you’ll have and adjustments you’ll make start to get people involved and thinking beyond the needs of their role or immediate area. It helps people think in systems—cause and effect.

Assess where you are with some of these values by looking at our original diagram. Let’s explore WIP for a minute:
Do you carry a lot of WIP? Do you multitask a lot? We might try limiting WIP.
Carrying a lot of technical debt? Is it slowing you down on new work? Maybe we should adjust the proportion of our WIP, increasing investment and decreasing new features.
Do you tend to work on big projects with long cycle times? Could you break this down into smaller chunks of value delivered to increase throughput?
Conversations and analysis lead to possible countermeasures and experiments around controlling system variables to see if others move in the direction we’d like. If we control this variable by trying X, what will happen? How would Y be affected?
Causal Loops For the People
Using causal loop diagrams in software delivery helps us understand the key factors affecting our results. These diagrams clarify how different variables interact, helping us find areas to focus improvement or investment.
The biggest benefit of causal loop diagrams is that they promote productive stakeholder discussions by externalizing what’s happening with a shared map. When product people and engineering people discuss these diagrams, they can better understand the system and work together to find solutions.
Additionally, these visuals increase awareness of the system beyond our individual roles, fostering a more collaborative problem-solving approach. This broader perspective lets team members see how their work impacts the whole system. A stupid backlog will never give you that.
Start using causal loop diagrams in your work by refining your models and engaging your team in discussions. Test your ideas and stay open to new insights. By focusing on systems and relationships, you'll better manage the complexities of software delivery and keep shipping at a sustainable pace and reasonable cost of change.
P.S. Try it yourself. Make your own model! The Miro board I used to create the graphics lives here.
P.P.S. What other variables are important to product and/or engineering? I might model some more in another post. Please share your ideas in the comments below 👇